An LLM visibility tool either tracks how often a brand appears in AI answers or investigates why products are missing. Tracking follows results over time and by engine, while diagnosis connects a specific problem to a proposed page change. A store with a healthy, rising number needs tracking, and a store with a low number and no explanation needs diagnosis first.
Reporting and repair share a label
The phrase “LLM visibility tool” covers products that answer different questions, so a comparison should start with the decision you need to make. Reporting a trend and deciding which product page to rewrite require different evidence, even when both begin with the same answers.
Reporting comes first. A marketing lead wants to know how the brand is doing in ChatGPT, Gemini and Perplexity, how that compares with rivals and whether it is improving, and a tracking tool serves that job well. Repair is the second: a store owner has noticed that assistants recommend rivals for the questions their customers ask and wants to know what to change, which is a diagnosis job. The two kinds of tool can share data and still produce different outputs.
Tracking gives breadth and consistency
Tracking tools send a fixed set of prompts to each engine they cover on a schedule, parse the answers and report how often the brand appears, in what position, with what sentiment and which sources the answers cite. The dashboard shows trends. Its charts summarize share of voice rather than establishing what caused a particular recommendation to change. Peec AI’s pricing page, for example, describes visibility, position, sentiment and share of voice “tracked daily against competitors.” Profound’s lists up to 10 engines on its Enterprise plan, and Brandlight’s product page lists 12 engines, from ChatGPT and Gemini to Grok and Naver.
Breadth and consistency are the strengths. A tracker shows whether a model update changed your standing on every engine overnight, whether a campaign moved the needle and how you compare with named rivals. For a brand that already appears regularly and needs to watch for drift, that is most of what it needs.
Tracking stops at the cause
A tracker reports the sum of every cause at once. When the line falls, it shows that something changed without showing which of four possible causes is responsible. The model may have stopped recognizing the brand name, filed a product in the wrong category, found a rival’s page that answers the buyer’s question better, or started citing review sites that favor competitors. Each of those causes needs a different fix, and a falling line gives no hint which one to start with, especially when the team has changed several pages or campaigns since the previous measurement and cannot separate their effects.
Some trackers go part of the way. Peec AI includes recommended actions on all plans, Brandlight describes gaps “ranked by impact, with a page edit list or brief attached” and Searchable includes site audits, all of which are useful additions that still start from brand-level tracking data.
Diagnosis adds the explain step
We call the stage between measuring and fixing the explain step: working out, for a specific product and question, which cause is responsible before anyone edits a page. Diagnosis tools center on that step. They look at the store’s own products and pages, run checks that each isolate one cause, and produce a list of fixes in order.
Metrisque works this way. Category Fit checks whether each product sits in the category shoppers expect, and in the latest read for 53 stores it marked 13 of 923 products Outside (1.4%), meaning Gemini similarity under 0.40. Brand Recall checks whether models know the exact store name, and Buyer Match checks whether pages answer what buyers need. Question Finder runs real shopper questions on model memory and web search and records who the models recommend. Competitors and Citations shows which rivals and sources the models favor. The Action Plan turns the findings into fixes and re-measures after each one.
The explain step matters because the obvious fix is often wrong. One store in Metrisque’s stored runs passed Brand Recall and still got no first-place mentions in 11 reads on memory and web search. Name recognition alone therefore cannot explain a recommendation gap, and the result leaves the actual cause still to be found.
| Job | Question it answers | Output | Who reads it | Example tools (as described on their own sites) |
|---|---|---|---|---|
| Tracking | How often and where do we appear, and is it changing? | Share of voice, position, sentiment and citation trends by engine | Marketing leads, agencies, leadership | Profound (up to 10 engines on Enterprise), Peec AI (daily visibility, position, sentiment, share of voice), Evertune (AI Brand Score), Searchable (visibility and citation tracking) |
| Tracking with guidance | Where are the gaps and what might help? | Trends plus suggested actions, audits or edit lists | Marketing and content teams | Peec AI (recommended actions), Brandlight (gaps with page edit list or brief), Searchable (site audits), AirOps (Opportunities and content workflows) |
| Diagnosis | Why is this product not recommended, and what should change? | Per-product causes, ordered fixes, before and after re-measures | Store owners, ecommerce and merchandising teams | Metrisque (Category Fit, Brand Recall, Buyer Match, Question Finder, Competitors and Citations, Action Plan) |
Table 1. The middle row is where most trackers are heading, and it explains why the line between the two jobs is blurring at the top of the market.
The measure and re-measure loop
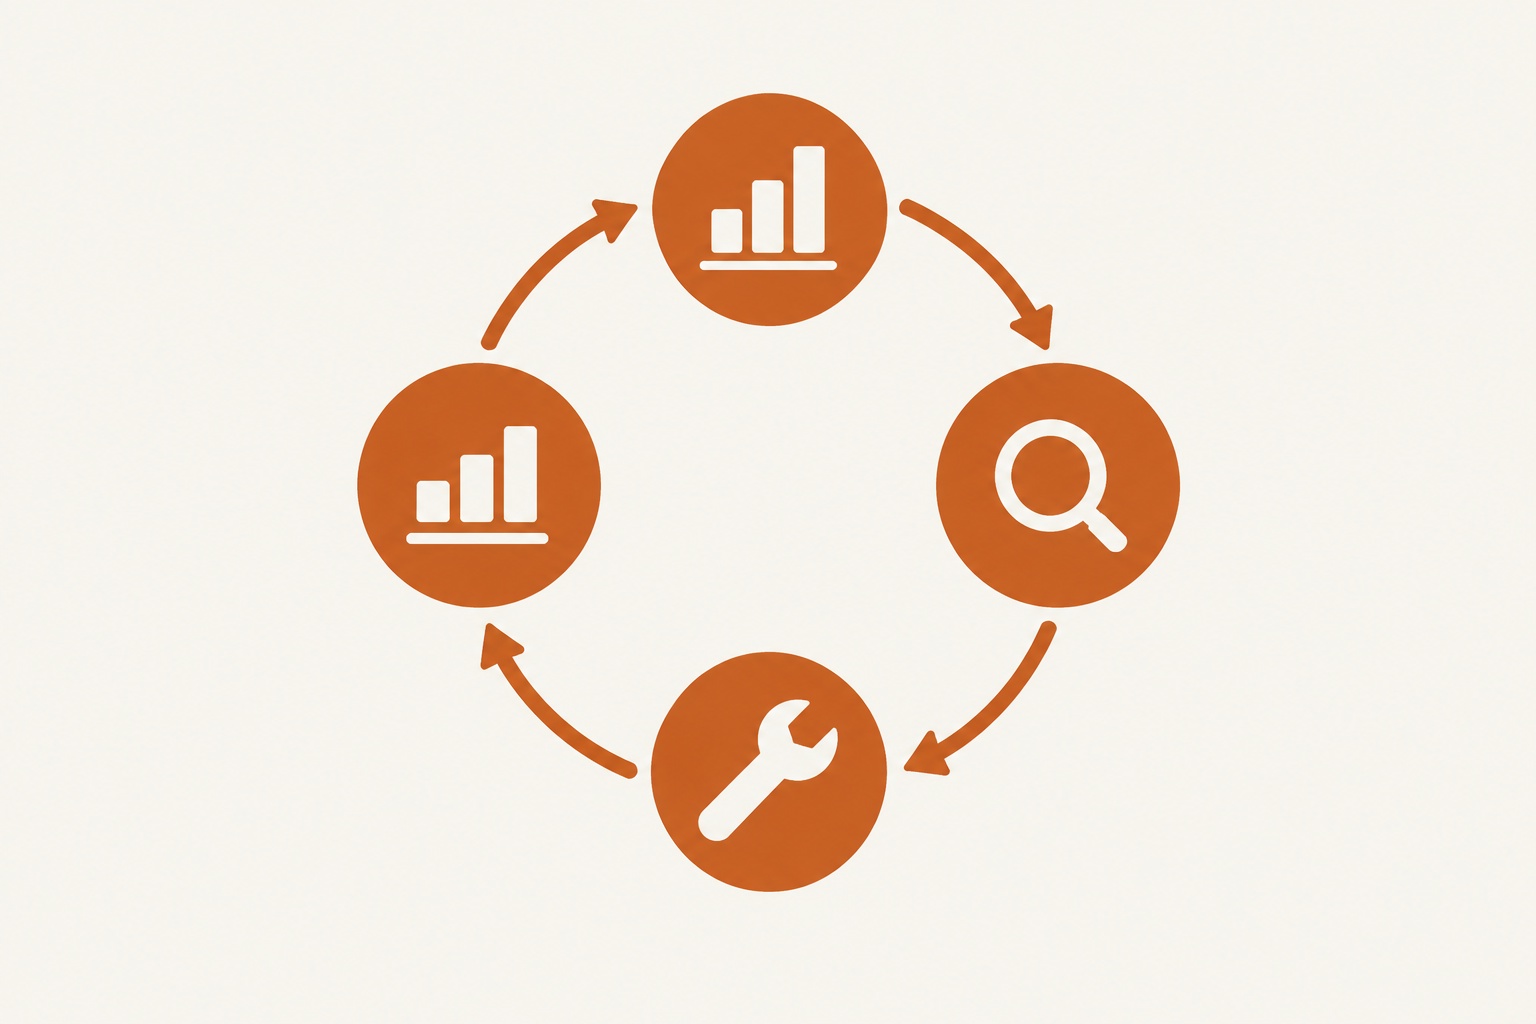
Diagnosis is only useful if a store can tell whether a fix worked, and that needs a measurement before and after under the same conditions. The full loop runs measure, explain, fix, re-measure. Tracking covers the first and last stages well. Diagnosis covers the middle two and closes the loop with a re-measure tied to the specific fix.
A synthetic description study provides a limited example: clear descriptions produced correct categories in 150 of 150 classifications, compared with 116 of 150 for vague descriptions. Clear means naming the product type, its purpose and key specifications early; vague means leading with mood or brand story. These 300 classifications measure category classification, not recommendations, and they do not establish what a live rewrite will achieve.
Answers vary between runs, so the re-measure needs the same questions, the same engines and enough repeats to see the normal spread. One answer proves little. A shift in position that holds over repeated reads, compared with a stored baseline, is evidence.
The job depends on the share line
Tracking alone fits a store that already appears often in AI answers for its main buying questions and wants to watch for drift, report to leadership or compare against rivals engine by engine. A tracker with broad coverage serves that need better than a diagnosis tool, and the larger trackers cover more engines than Metrisque’s three measured ones (ChatGPT, Gemini and Claude, per its homepage).
Diagnosis comes first for a store whose products are missing or rarely first, with no visible reason in the share line. The signs are familiar: rivals named for every buying question, a brand the model knows by name but never recommends, products the model describes as something they are not, all of which diagnosis turns into specific edits on specific pages, ordered by which cause blocks the others.
Both jobs pay off once AI answers drive enough traffic that a fall would hurt and the store has a team to act on findings. Diagnosis fixes the causes on its own pages, and tracking then watches the wider picture so the team catches a new problem early. Our comparison of AI visibility tools sets out which tools cover which stages, with sources for every claim.
Vendor questions for a demo
Ask three questions. What does the output tell my team to do on Monday? Does it separate model memory from web search answers, since the two respond to different fixes? Can it show a before and after for a specific change, measured under the same conditions? A tool that answers all three well covers the loop, while a tool that answers only the first with a chart is a tracker, which may be exactly what you need.
Can one tool do both tracking and diagnosis?
Some trackers add suggested actions, audits or page edit lists, so the boundary depends on what their recommendations actually explain. Check whether the tool identifies a product-level cause and ties a repeated measurement to the specific change your team makes.
Questions people ask
What is an LLM visibility tool? It is software that asks AI models questions and records whether and where a brand appears in the answers. Some tools track that over time, while others investigate why a brand or product is missing and suggest specific fixes.
What are AI search visibility tools used for? Tracking tools report share of voice, position, sentiment and citations by engine over time. Diagnosis tools find the cause of a low result, such as a product filed in the wrong category, and re-measure after a fix.
Do I need an LLM SEO tool if I already track rankings? Search rankings do not show whether AI assistants recommend your products. If AI answers matter to your sales, you need at least a periodic read of AI recommendations, and a diagnosis when they are low.
Can one tool do both tracking and diagnosis? Some trackers now add suggested actions, audits or page edit lists. A store whose products are missing should check whether a tool works at product level and re-measures after each specific fix.
Sources
- Peec AI pricing, https://peec.ai/pricing, checked on 17 November 2026.
- Profound pricing, https://www.tryprofound.com/pricing, checked on 17 November 2026.
- Brandlight visibility product page, brandlight.ai (product section), checked on 17 November 2026.
- Evertune AI Brand Index, https://www.evertune.ai/products/ai-brand-index, checked on 17 November 2026.
- Searchable pricing, https://searchable.com/pricing, checked on 17 November 2026.
- AirOps pricing, https://www.airops.com/pricing, checked on 17 November 2026.
- Metrisque homepage (engines measured), https://metrisque.com/, checked on 17 November 2026.
- Metrisque stored runs: Category Fit latest read (13 of 923 Outside, 53 stores). Question Finder case (11 reads). description clarity study (300 classifications). Read on 16 November 2026.